
How To Guide / Start Here

This place delivers daily, systematic technical analysis across ~200 securities spanning equities, fixed income, FX, commodities, and crypto. No opinions. No narratives. Just raw output.
Every day after market close, the platform scans every instrument for trend direction, momentum strength, reversal signals, and exhaustion counts — so you don't have to.
What's inside:
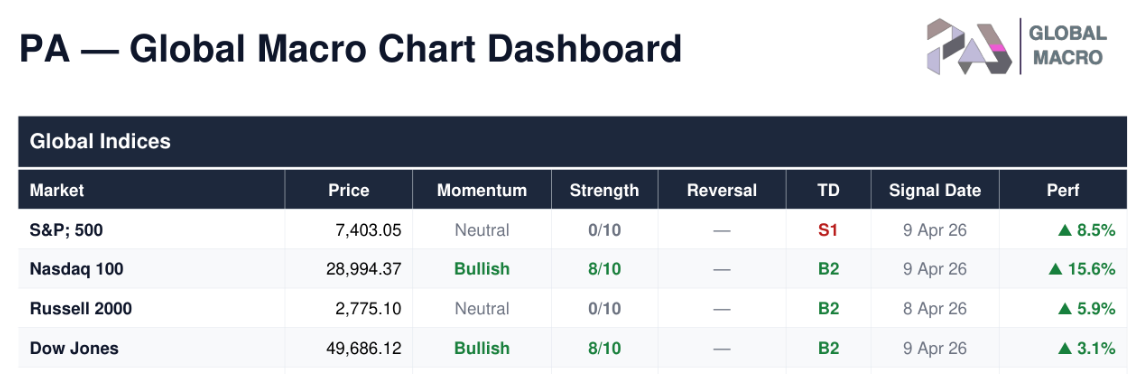
The Chart Dashboard
One view across all 200 securities. Momentum, trend strength, reversal warnings, and TD Sequential counts for every instrument, updated daily.
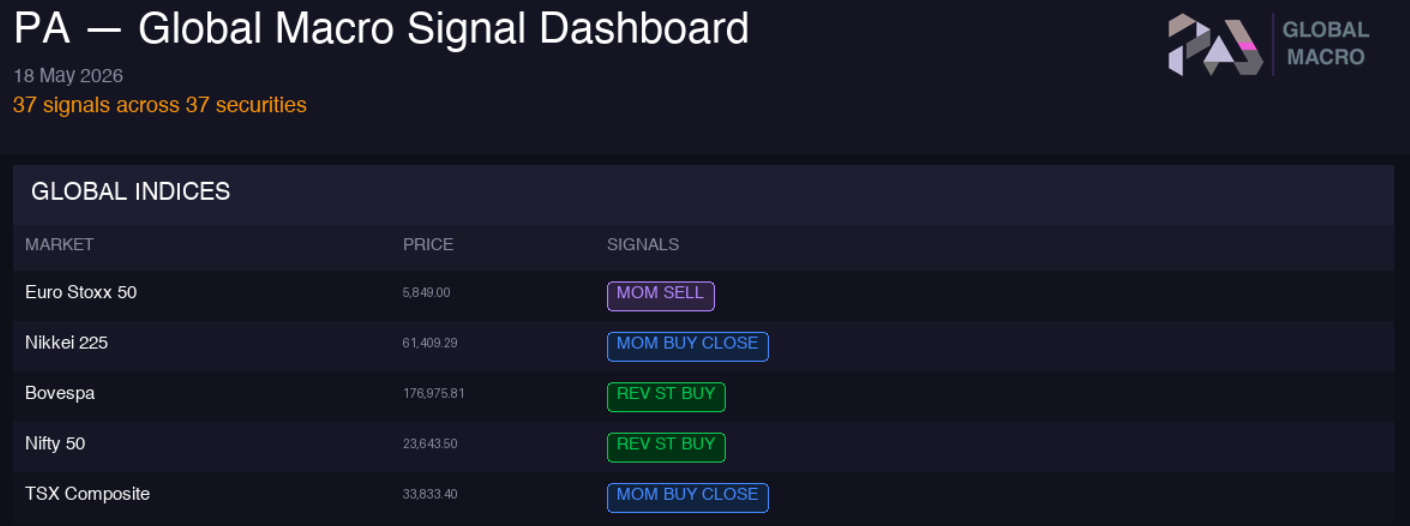
The Signal Dashboard
A daily scan that tells you exactly what changed. New momentum flips, reversal signals, and exhaustion counts — only the instruments that fired a signal appear.
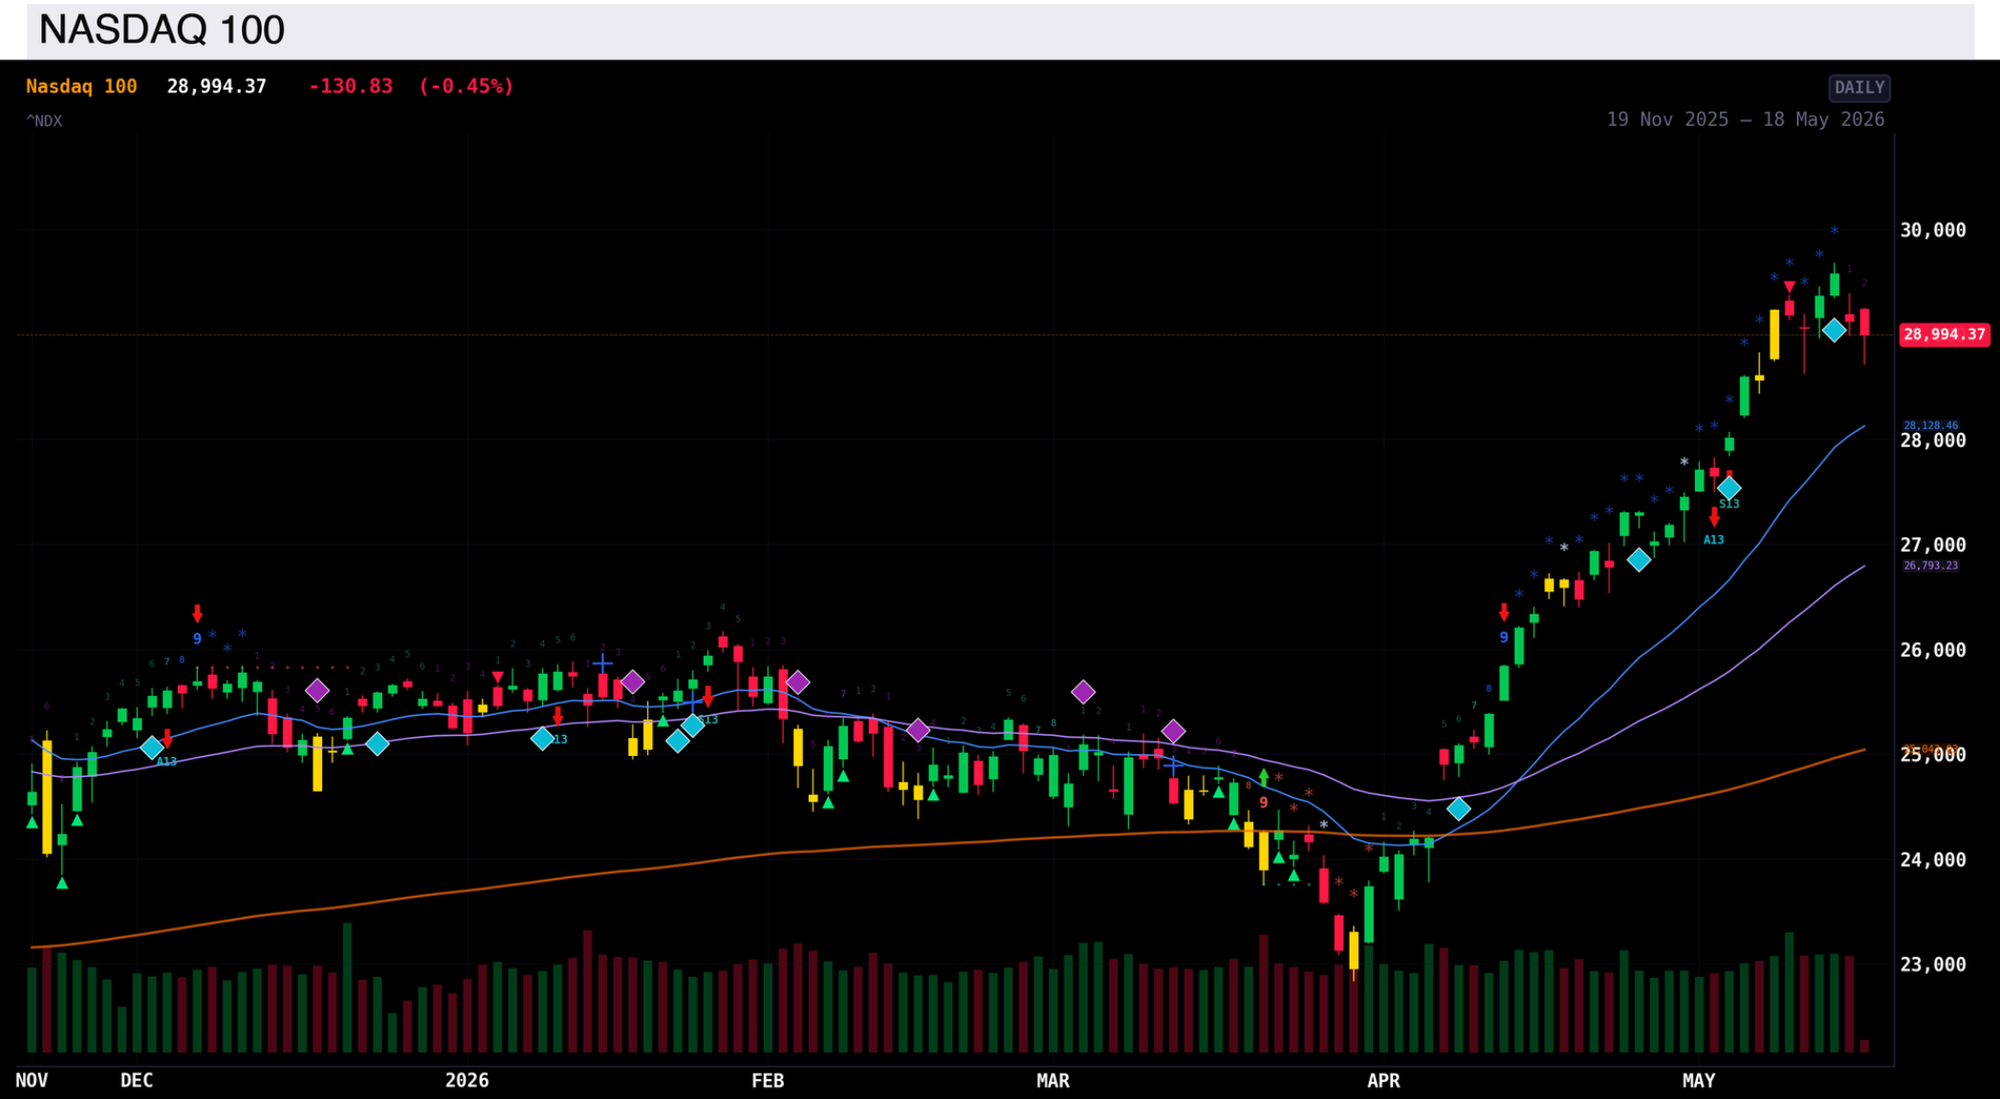
The Chart Book
Individual charts for every security with candlesticks, moving averages, and all proprietary signal overlays. Drill into anything the dashboard flags.
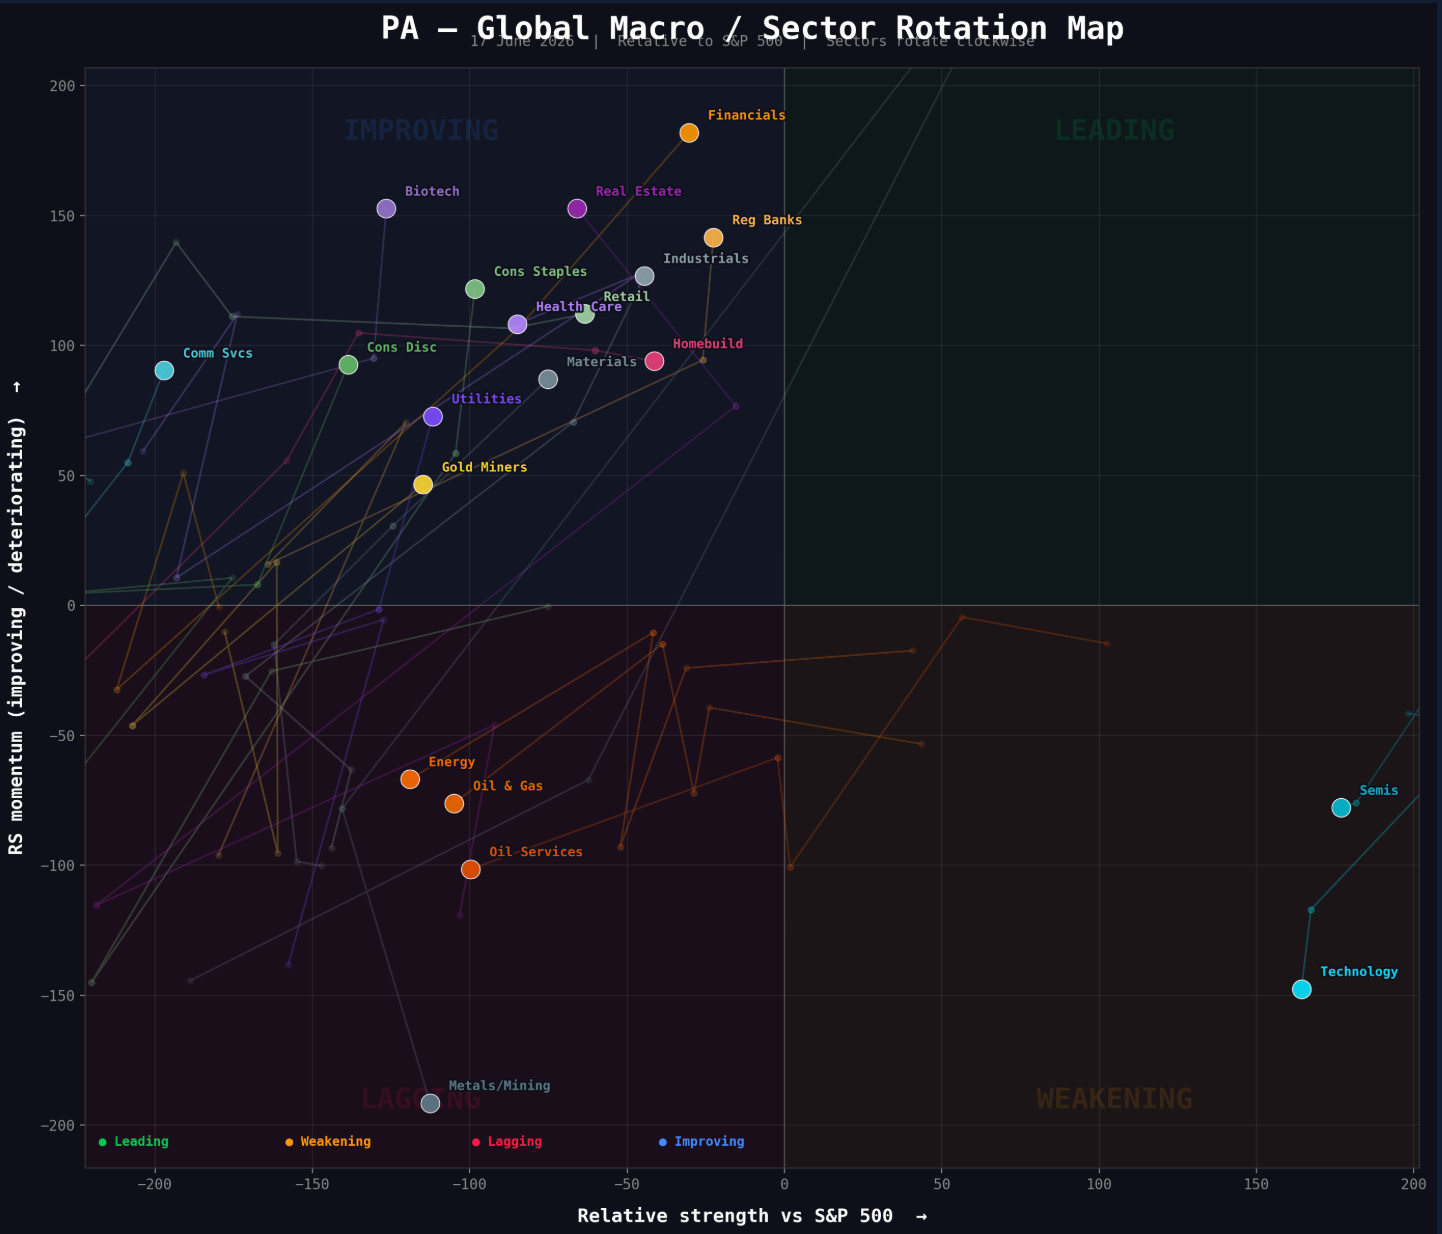
The Sector Rotation Map
A daily overview and tracking of relative sector strength within US sectors, visualising trends and out- and underperformance.
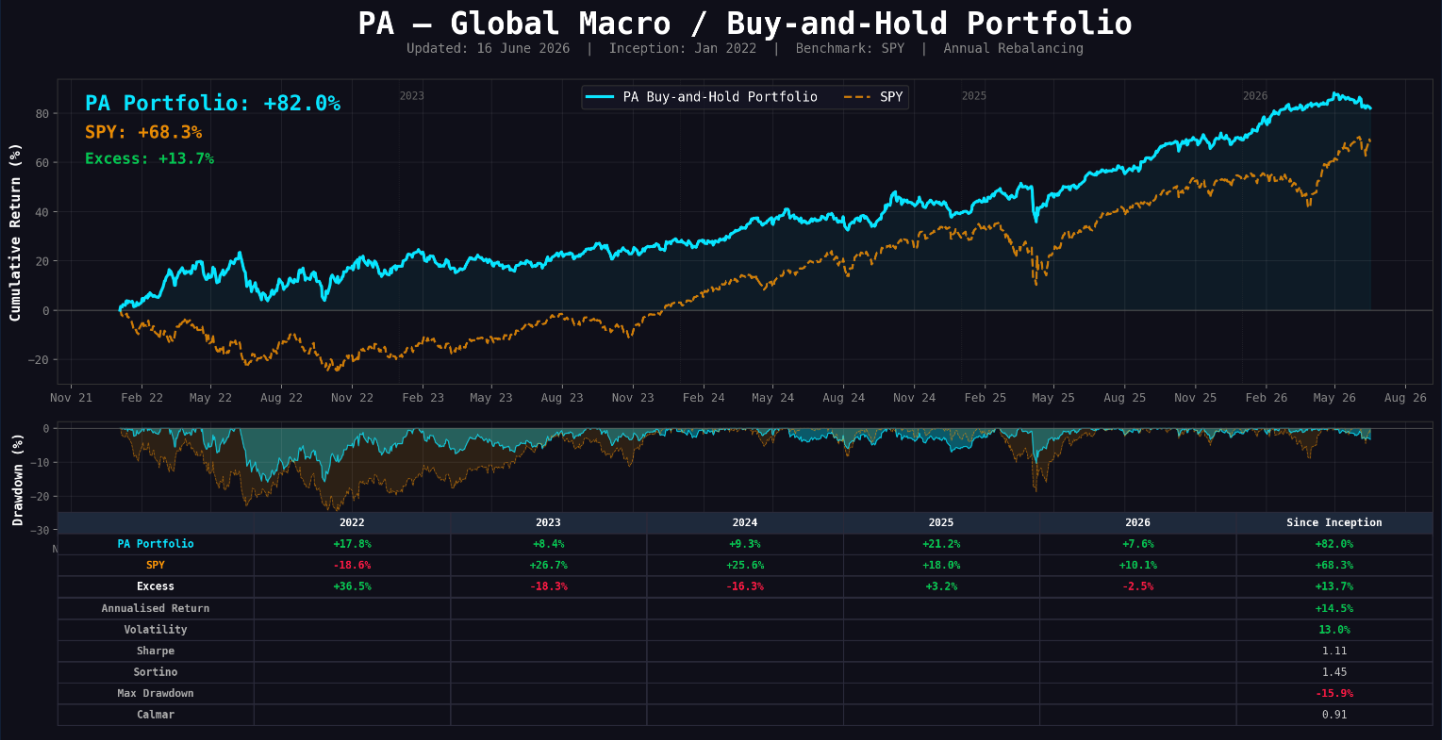
The yearly buy-and-hold portfolio
Since 2022, I have set out an annual portfolio consisting of liquid ETFs to capture the most important secular macro views. The daily update tracks performance at the overall portfolio and detailed security levels, as well as all relevant risk indicators.
Built by a macro practitioner, not a data vendor. The models are the product of over two decades of working across macro investment firms and hedge funds. The same indicators used in the daily commentary on paperalfa.com are now delivered as a systematic, data-driven platform.
Current subscribers receive all future features and enhancements at no additional cost.